Prepared with AI assistance · Original project data · Advertising disabled
How to read and reproduce this archive
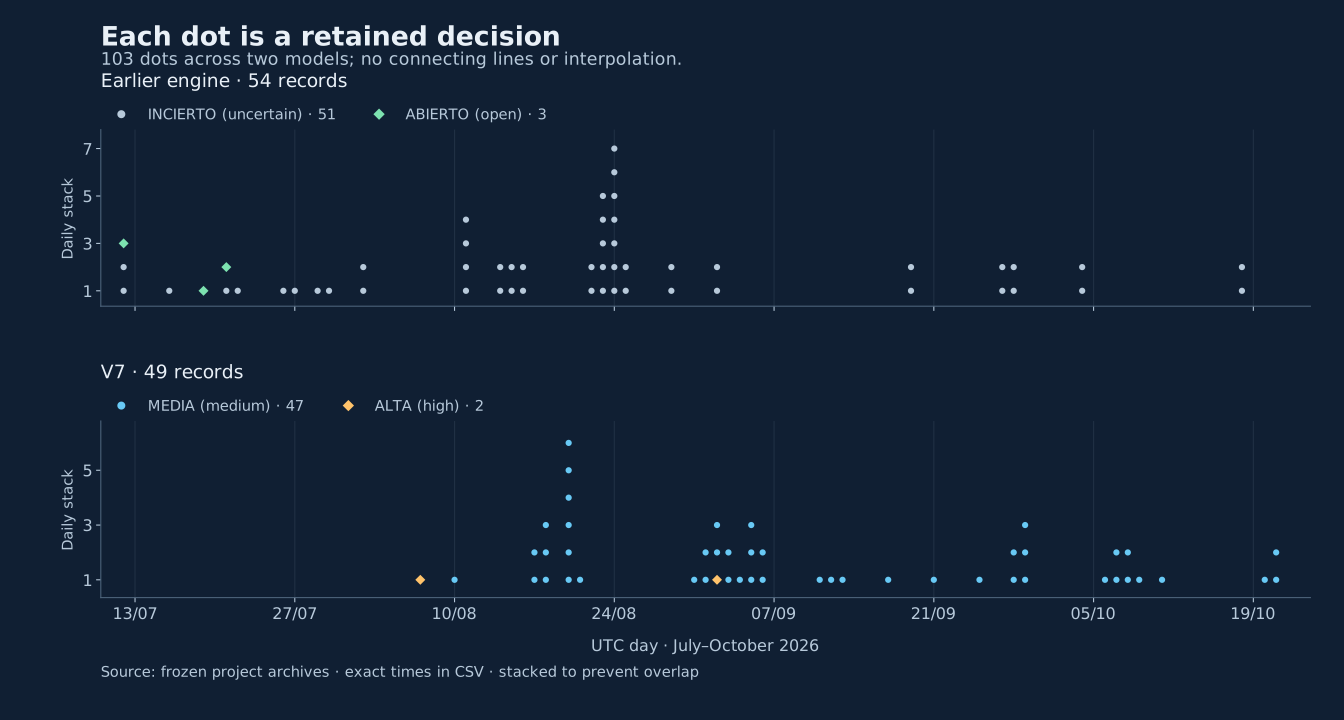
This method accompanies the historical analysis, not the live status. The 103 records are stored decisions from two models, not vessel positions or a periodic traffic series.
Step-by-step reproduction
- Download records.csv. Its six columns hold model, timestamp, classification, confidence and two boolean indicators of measurement availability; they do not contain measurements.
- Parse timezone-aware dates and convert to UTC. Separate legacy and v7; verify model/timestamp uniqueness. Do not add rows or fill missing days.
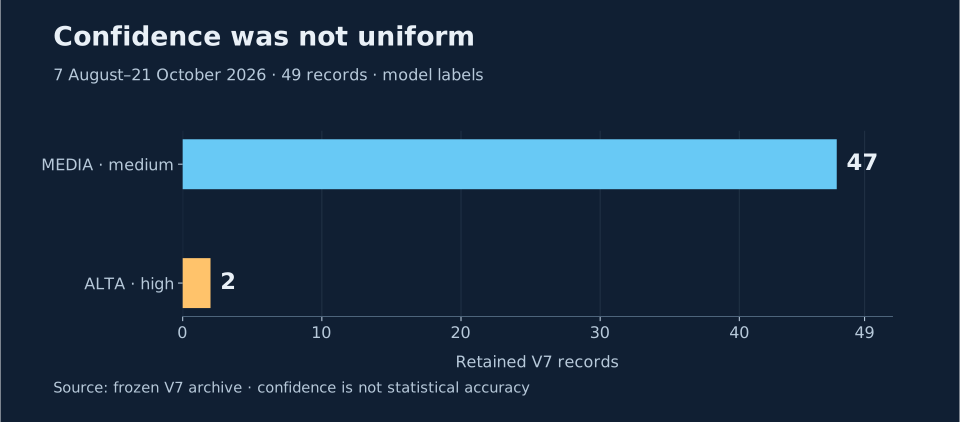
- Count rows by model, classification and confidence. Results: legacy 54 (51 INCIERTO, 3 ABIERTO); V7 49 (47 MEDIA, 2 ALTA), with the same V7 operational label in all 49 rows.
- Filter v7 for each window: inclusive start and exclusive end. Count rows and distinct UTC dates. Several rows on one day count as one date.
- First window [2026-09-10T00:00:00Z, 2026-10-01T00:00:00Z): 11 rows, 8 days, 11 MEDIA. Second [2026-10-01T00:00:00Z, 2026-10-22T00:00:00Z): 10 rows, 7 days, 10 MEDIA. Each window spans 21 days.
- Sort by model and timestamp. Within each model/day assign consecutive rows positions 1, 2, 3… . plot.csv preserves exact time, day and position; height only separates symbols.
- Draw separate model panels: X = UTC day, Y = stack position; one symbol per row, no lines or interpolation. Encode classification for legacy and confidence for V7. The bar chart represents the counts 47 and 2.
- Check tables against models.csv, confidence.csv and windows.csv. The two ALTA records are 7 August at 12:21:33 UTC and 2 September at 11:41:03 UTC, outside both windows. Do not calculate vessel counts, traffic declines, closure hours or accuracy.
Sources and integrity
The two original technical archives were frozen at the commit shown; their hashes identify the inputs used. The public snapshot projects selected fields and is not a complete copy of technical archives. The original CSV is preserved exactly. The earlier engine spans 12 July–18 October 2026 and V7 7 August–21 October 2026. Integrity check recorded on 24 October 2026: three HTTP 200 sources with matching hashes. This does not verify maritime traffic or update past observations.
| Fuente / Source | Commit | SHA-256 LF |
|---|---|---|
| Motor anterior / Earlier engine | 373545ee044e4fd40fd6899aa48dff990f8b1a1c | c0f2489a82158806459af35c708d64f2a56121f87098ed49860547d6c01490a1 |
| V7 | 373545ee044e4fd40fd6899aa48dff990f8b1a1c | 3d2553c407eb985f90ffc81082ca28a589d7f9843e885efda07c4eff5219cc97 |
| CSV original / Original CSV | 9d6b0cf592b9a85313cc5f33978a48405edf520d | de685c60a83b797b63f158052c97e52b6b2bee5e0898679625edd5664772e092 |
Frozen snapshot: earlier engine · V7
Original data and charts
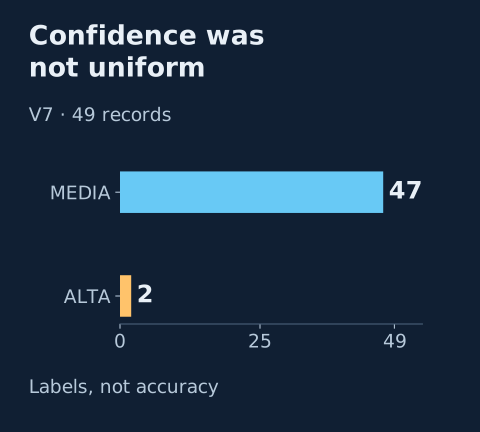
The original SVGs retain 54 and 49 unique centres. Minimum measured separation is 8.55849 SVG units, greater than the conservative diameter of 8. Shapes and colour distinguish categories; confidence has a mobile layout. The timeline retains minimum width and scrolling to avoid compressing points and dates.
- records.csv
- models.csv
- confidence.csv
- windows.csv
- plot.csv
- SVG: timeline
- SVG: confidence
- SVG: confidence-mobile
Limitations and reuse
Days without a row prove neither an absence of ships nor service outages. The examined V7 fields contain no numeric traffic ratio or maritime-count snapshot. MEDIA and ALTA are model labels, not calibrated probabilities. Method changes and retention prevent treating both archives as one maritime series.
Decision metadata and charts prepared by the project. Sources, version and attribution are documented here. The archive excludes AIS positions and media article bodies.
Publisher editorial approval: 24 October 2026. Prepared with AI assistance.